

A place value chart is a grid that shows what each digit in a number is worth based on where it sits. This page gives you printable charts for whole numbers (ones through millions) and decimals (tenths through thousandths), plus quick steps to use them and hands-on activities you can run today. Everything here works whether you’re teaching one child at the kitchen table or a full classroom.
TL;DR:
- The choice of place value chart should match the student’s grade and number range, from simple ones-tens-hundreds for early learners to millions for older students.
- Anchoring to the ones column or decimal point first helps prevent confusion and ensures accurate digit placement when working with whole numbers or decimals.
- Physical activities like building numbers with blocks or cards and practicing moving digits reinforce understanding better than rote worksheets alone.
- Variations such as accordion charts, decimal-only charts, or mixed charts can be tailored to different lessons and accessibility needs for more effective teaching.
- Emphasizing the role of zero as a placeholder early on prevents common errors and builds a solid foundation for understanding large numbers and decimals.
Table of Contents
- Which Place Value Chart Printable Should You Use?
- How to Use a Place Value Chart Step by Step
- Hands-On Activities That Make Place Value Stick
- Chart Variations Worth Knowing About
- Where Place Value Charts Came From
- Place Value Beyond Base-10
- What Actually Moves the Needle on Place Value
- Ready-to-Print Worksheet Packs for Every Grade
- Where These Charts and Facts Come From
- Sources
Which Place Value Chart Printable Should You Use?
Not every chart fits every lesson, and grabbing the wrong one wastes a teaching moment. The right printable depends on your student’s grade and what number range they’re working with.
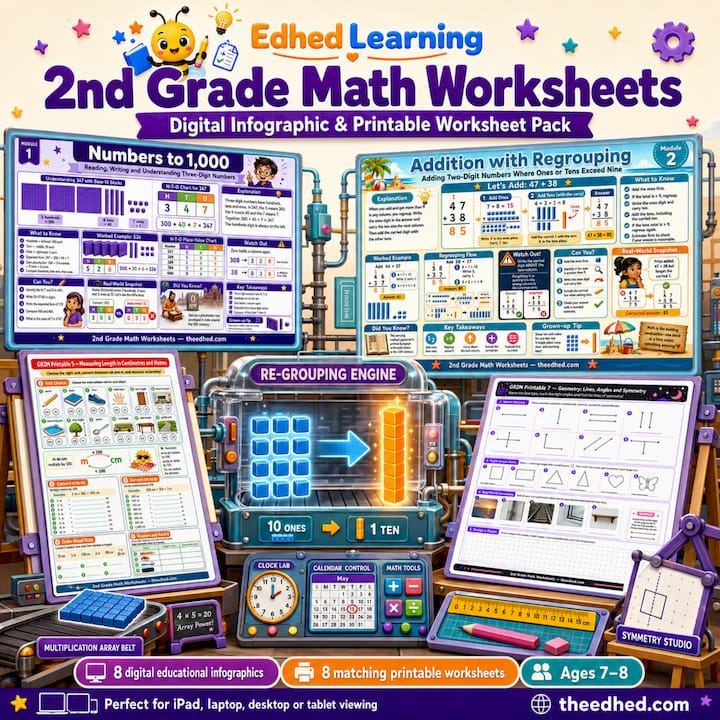
For kindergarten through 2nd grade, start with a simple ones-tens-hundreds chart. Young learners need to see just three columns before their brains can hold more. Simple charts with clearly labeled spaces are more effective for younger learners than charts with many columns they do not yet need.
By 3rd through 5th grade, kids are ready for a chart extending to thousands, then ten thousands and hundred thousands. This is also when decimal charts enter the picture, usually starting with tenths and hundredths once multiplication and division are solid.
For upper elementary and beyond, a chart stretching to millions (with comma-separated periods) helps kids see how numbers group into sets of three digits. Decimal place value charts including thousandths are often introduced when students begin learning about money and measurement conversions.
Here’s a quick breakdown of chart types and when to reach for each one:
- Ones to hundreds chart: best for kindergarten and 1st grade introductions to two- and three-digit numbers.
- Ones to thousands chart: ideal for 2nd and 3rd grade, once regrouping and carrying enter the curriculum.
- Ones to 100,000 chart: fits 4th grade work with large whole numbers and rounding.
- Ones to millions chart: suited to 5th grade and up, when students need to name periods (thousands, millions) confidently.
- Decimal charts (tenths to thousandths): appropriate once multiplication and division of whole numbers are secure, typically late 4th grade onward.
On format, a laminated PDF turned into a dry-erase mat holds up to daily reuse and lets you wipe it clean between students. An accordion-style chart, built by folding and taping printed strips together, works well for whole-class demonstrations because you can physically stretch or collapse it to show how the number of digits changes. Standard flat PDFs are still your best bet for independent seatwork and homework packets, since they’re quick to print in bulk.
How to Use a Place Value Chart Step by Step
Using a place value chart correctly comes down to one habit: anchor the ones column first, then work outward from there. Skip this step and kids start guessing where digits belong, which is where most confusion starts.
- Find the ones column. For a whole number, the last digit always lands in “ones.” Everything else fills in going left: tens, hundreds, thousands, and so on.
- For decimals, anchor the decimal point instead. Digits to the left of the point follow the same whole-number rule. Digits to the right go into tenths, hundredths, and thousandths, reading in the opposite direction from whole numbers.
- Read the value of each digit aloud. Take the number 863.951. The 9 sits in tenths, the 5 in hundredths, and the 1 in thousandths, based on how Brilliant explains decimal place value. Saying “nine tenths, five hundredths, one thousandth” out loud cements the connection between position and value.
- Write the expanded form. That same number becomes 800 + 60 + 3 + 0.9 + 0.05 + 0.001. Expanded form is where a lot of kids finally “get” place value, because it forces them to name every digit’s job.
- Demonstrate multiplying and dividing by 10 or 100. Have the student physically slide every digit one column to the left to multiply by 10, or one column to the right to divide by 10. Watching the digits move, rather than just recalculating, makes the pattern stick.
A common mistake is misunderstanding zero’s role as a placeholder, which can lead to dropping zeros and misreading numbers. Catching this early saves months of confusion later, since zero’s placeholder role only gets more important as numbers grow larger.
Pro Tip: Before assigning a worksheet, have your student read a five-digit number aloud using the chart, one column at a time. If they stumble on the zero, stop and fix it there. It takes thirty seconds and prevents a habit that’s much harder to unlearn once it sets in.
Hands-On Activities That Make Place Value Stick
Charts work best when they’re paired with something a child can touch, move, or race against a partner to finish. These activities turn a static grid into an actual lesson.
- Base-ten blocks: have students build a number physically, then transfer it digit by digit onto the chart. This bridges the concrete (blocks) to the abstract (the chart’s columns).
- Place-value cards: stack cards representing 1, 10, 100, and so on, then overlap them to form a number. Kids see exactly which digit “covers” which column.
- “Zero the Hero”: a placeholder game where a character named Zero has to fill every empty column so digits don’t shift out of place. This is especially useful for kids who keep dropping zeros in numbers like 4,003.
- Make-a-number challenges: roll dice or draw digit cards, then race a partner to build the largest (or smallest) number possible on two separate charts.
- Compare-place-value races: two students build numbers simultaneously and compare which digit in which column makes one number bigger, reinforcing that a 5 in the hundreds column always beats a 9 in the tens column.
- Decimal decimal-point hops: using a printed number line or chart, have students “hop” the decimal point left or right to simulate multiplying or dividing by 10, 100, or 1,000.
For quick checks, keep an exit ticket ready: give students one number to place on a blank chart and one to convert into expanded form. It takes under two minutes to grade and tells you instantly who needs more support before you move on. Small-group scaffolds work well for struggling students. Pull four or five kids aside, hand them oversized column cards, and have them physically stand in the correct place value order. It sounds simple, but standing in the “hundreds” spot while holding a card tends to stick in a way that worksheets alone don’t.
Chart Variations Worth Knowing About
Not every place value chart looks the same, and matching the variation to the task saves confusion.
Accordion charts versus single-row charts serve different purposes. An accordion chart, made by folding connected strips, is built for demonstration. You stretch it out to show a huge number, then collapse it to show a small one, which makes it perfect for whole-group instruction. A single-row printable chart is better for independent practice, since one student working alone doesn’t need the theatrics.
Decimal-only charts strip away the whole-number columns entirely and focus purely on tenths, hundredths, and thousandths. These work well once a student already understands whole-number place value and needs focused decimal practice without visual clutter.
Mixed charts combine whole numbers and decimals in one continuous line, split by a bold decimal point. Most teachers introduce decimals this way first, since it keeps the connection to whole-number place value visible.
On accessibility, a few small adjustments go a long way:
- Larger boxes with more white space help younger children and students with fine motor challenges write digits clearly.
- High-contrast color choices (dark text on light backgrounds, avoiding red-green combinations) support students with visual processing differences or color blindness.
- Bold column dividers make it easier for students to track which digit belongs where, especially on charts extending to six or seven columns.
Customizing a chart is straightforward. Add a period (like ten-thousands) by inserting a column, remove one for younger grades, or laminate the printable so students can write on it with dry-erase markers and reuse it daily instead of printing a fresh copy every lesson.
Where Place Value Charts Came From
Place value as a concept is older than the printable chart itself. The idea that a digit’s position determines its value traces back to ancient number systems, most notably the Hindu-Arabic system developed in India roughly 1,500 years ago and later carried into Europe through Arabic scholars. Before positional systems existed, ancient Rome used numerals where symbols simply added together (like adding I, V, and X), with no column-based value shift at all.
What made the Hindu-Arabic system revolutionary was the invention of zero as a true placeholder. Without it, there was no clean way to distinguish 40 from 4 or 400. Once zero entered the system, numbers could be written far more efficiently, and arithmetic that used to require counting boards or abacuses became something you could do on paper.
The printable classroom chart as we know it, with clearly labeled columns for ones, tens, and hundreds, is a much more recent teaching invention, born out of the need to make an invisible abstract concept visible to young learners. Manipulatives like base-ten blocks and place-value cards followed the same logic: they turn a mental structure into something a child can physically rearrange. The chart format simply gives that structure a permanent, reusable home on paper.
Place Value Beyond Base-10
Every chart described so far assumes base-10, the number system where each column is worth ten times the column to its right. That’s not the only way to organize numbers, and understanding an alternative system actually sharpens a student’s grip on why base-10 works the way it does.
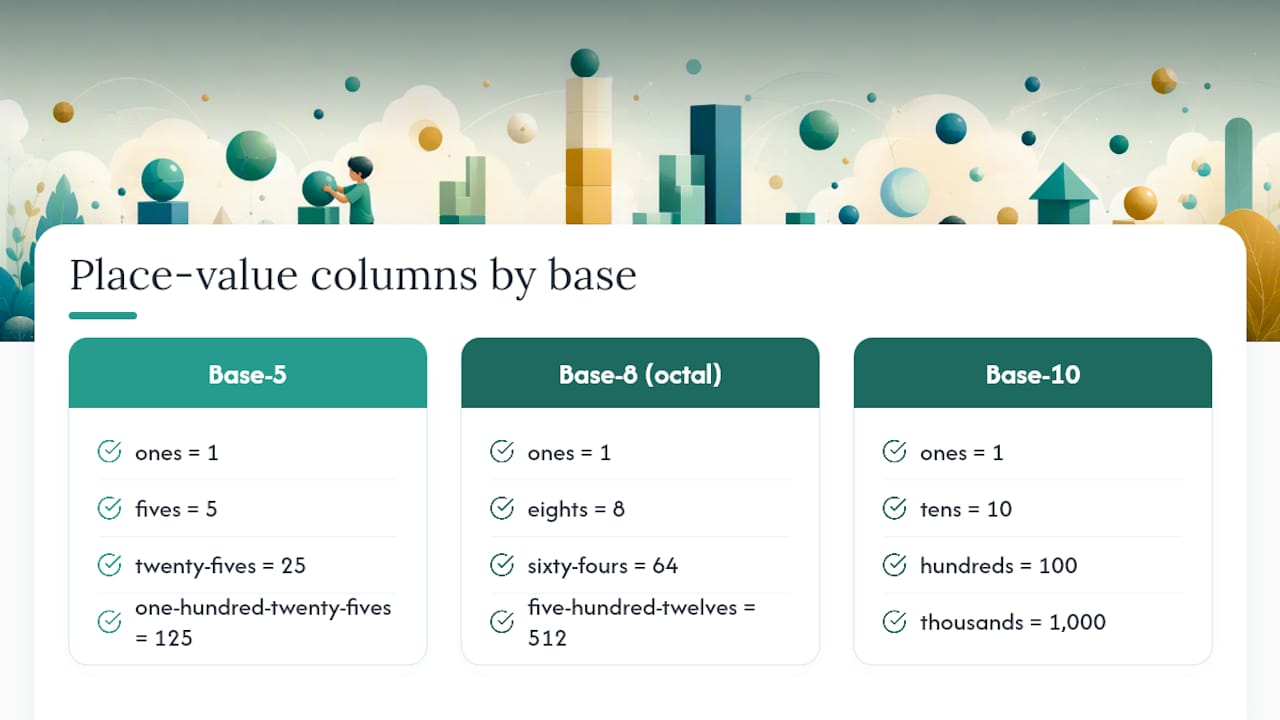
In base-5, each column is worth five times the one before it instead of ten. The columns read ones, fives, twenty-fives, one hundred twenty-fives, and so on. A number written as “23” in base-5 doesn’t mean twenty-three. It means two fives plus three ones, or thirteen in base-10.
Base-8, sometimes called octal, works the same way but with columns worth eight times the previous one: ones, eights, sixty-fours, five hundred twelves. Base-8 shows up in computer science because it maps cleanly onto binary (base-2) data in groups of three bits.
The teaching value here isn’t turning elementary students into computer scientists. It’s showing older or advanced learners that “carrying the one” and “borrowing” aren’t rules tied specifically to the number 10. They’re rules tied to whatever base you’re using. A 5th or 6th grader who tries building a few numbers on a base-5 chart usually walks away understanding base-10 place value more deeply, simply because they’ve seen the pattern repeat somewhere unfamiliar.
What Actually Moves the Needle on Place Value
Most place value instruction spends too much time on worksheets that ask kids to identify a digit’s value and too little time on the physical act of building and rearranging numbers. The research bears this out. Watching digits move, whether through an accordion chart or colored place-value cards, tends to cement the concept of multiplying and dividing by powers of ten far faster than repeated written drills alone.
The conventional advice, “practice more problems,” isn’t wrong, but it’s incomplete. A student who’s memorized that multiplying by 10 “adds a zero” without understanding why will hit a wall the moment decimals or negative exponents show up. The chart isn’t just a worksheet. It’s a physical model of a rule kids need to internalize, not memorize.
If you’re prioritizing one thing, prioritize the zero-as-placeholder lesson before anything else. Nearly every downstream mistake, from misreading large numbers to fumbling decimal alignment, traces back to a shaky understanding of what zero is actually doing in a number. Get that right early, and the rest of place value instruction gets noticeably easier.
— Shaun
Ready-to-Print Worksheet Packs for Every Grade
Once your student has the chart down, the next question is always the same: what do they practice on? Edhed Learning builds worksheet packs specifically so you’re not stuck hunting for grade-appropriate practice after a lesson, since each pack pairs directly with the skills a place value chart teaches.
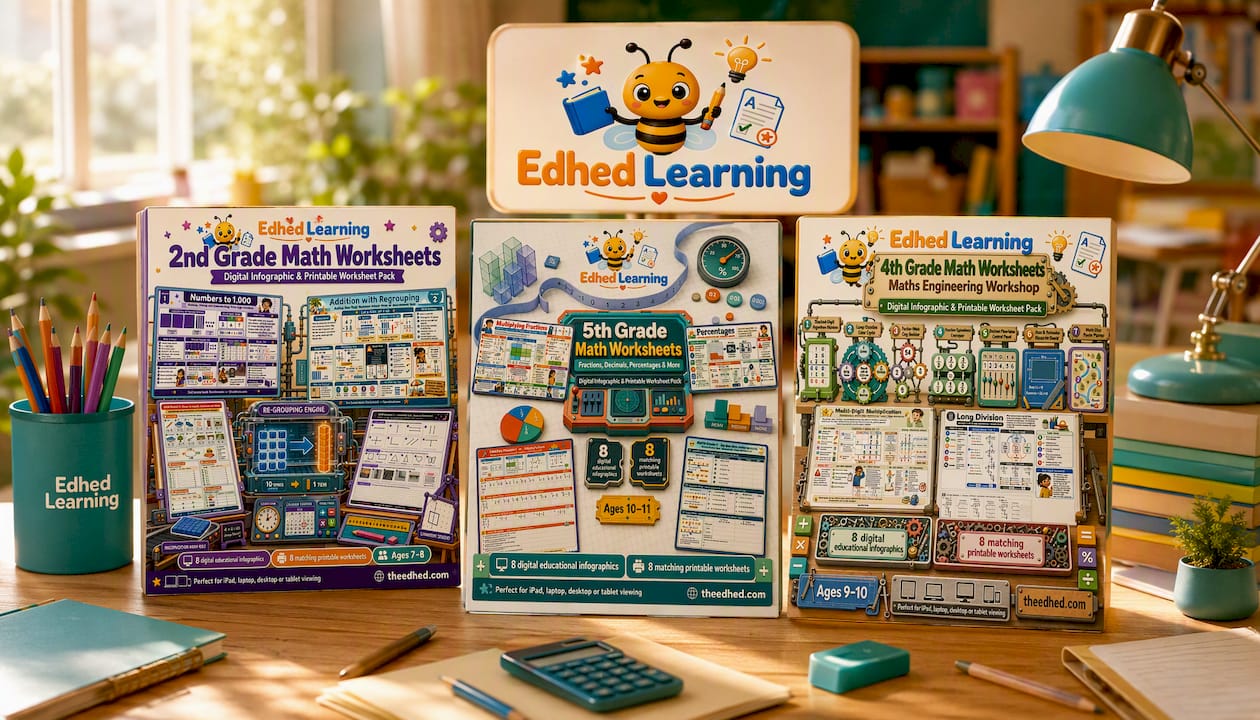
The 2nd grade math worksheets pack covers ones-to-thousands place value with the bright, hands-on visuals Edhed Learning is known for, ideal for kids just past the ones-tens-hundreds stage. The 4th grade math worksheets pack steps up to larger whole numbers and early decimal work, matching the ten-thousands and hundred-thousands charts covered above. The 5th grade math worksheets pack goes furthest, tackling decimal place value through thousandths for kids ready for real enrichment.
Buying a pack instead of assembling practice sheets yourself saves hours, and every pack downloads instantly so you can print exactly what each student needs for classroom differentiation. Head to any of the links above, choose your grade, and check out to get instant access. Classrooms with multiple teachers can request a licensing note at checkout for shared use across a grade team.
Where These Charts and Facts Come From
- Brilliant’s place value entry for decimal definitions and worked examples.
- MathIsFun’s place value guide for accessible explanations of zero as a placeholder.
- LibreTexts on place value and whole number names for period grouping and expanded form.
- Arc’s printable place value chart table for downloadable chart formats and classroom guidance.
Sources
- HowStuffWorks — Place value chart
- Arc — Place value charts: Table
- Brilliant — Place value
- LibreTexts — Place value and names for whole numbers
- Third Space Learning — The best place value charts (printable accordion)


